Creating a Dashboard
The dashboard interface is extremely flexible, allowing dashboards to be used for both passive monitoring as well as for active deep-dive or root-cause analysis.
Dashboards are interactive and allow you to visualize and pivot your data on multiple facets, analyzing them holistically or granularly. A Dashboard can hold multiple datasets for disparate data sources.
Dashboards are made up of widgets, or custom visualizations of your data. A dashboard can be split into multiple tabs to create focus areas within your dashboard. The level of connectedness between tabs is customizable. Interactions can affect the entire dashboard, only certain tabs, or just the tab you’re on. See the Dashboard Tabs page to learn more about this.
To create a new dashboard, from the homepage, click on the New Dashboard icon:
Dashboard Options
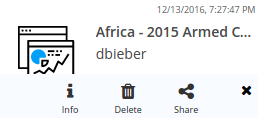
Once you’ve created a dashboard, you can Permission Levels, delete, or modify properties by clicking on dashboard menu:
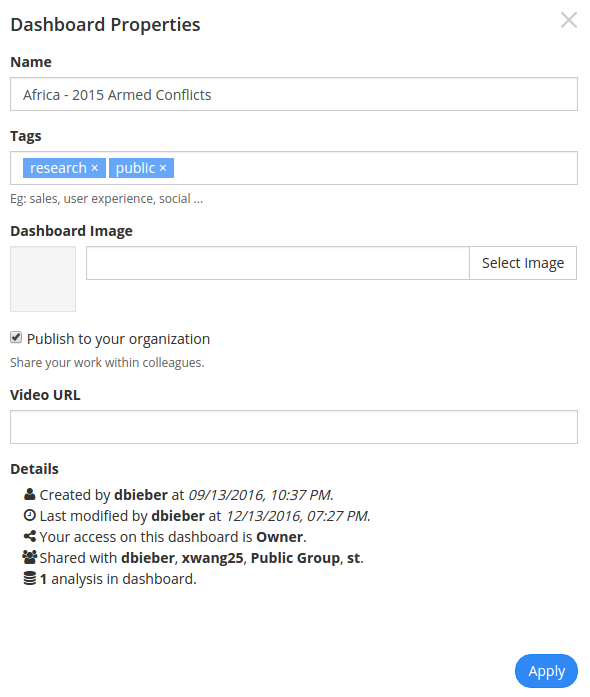
Dashboard Properties
This is where you can add tags, an image, or even a video, as well as see who else has access.
Note
If a dashboard has been shared with you, you might see a dashboard menu that looks like this:
This means you do not have permission to share with others. For more on permissions, see Administration